

Sales Funnel Analytics and KPIs: A Practical Guide for 2026
What if leads stall not because you need more activity, but because you can’t see where prospects drop off? Sales funnel analytics and kpis can show which campaigns attract qualified opportunities, where prospects stop moving forward, and whether follow-up is helping turn inquiries into sales. The key is choosing numbers that point to a useful next step.
If lead and sales data live across ad platforms, your website, and your CRM, you can end up with plenty of reports but few clear answers. Clicks and inquiries don’t show by themselves which leads become real opportunities or revenue. Without consistent tracking, it’s harder to locate a bottleneck or decide what to improve.
This guide explains how to choose a focused set of KPIs for each funnel stage, calculate them consistently, and interpret results in context. You’ll learn how to connect campaign activity with lead quality, follow-up, and sales outcomes, then use the evidence to choose what to improve next. Less metric overload, more clarity about where your funnel needs attention.
Key Takeaways
- Use sales funnel analytics and kpis to see where prospects move forward, stall, or drop out, then focus on the stage that needs attention.
- Track practical measures such as inquiry-to-qualified-lead rate, appointment or estimate rate, close rate, and lead response time.
- Compare conversion rates only when funnel stages, lead sources, and measurement windows match.
- Keep lead status, source, timestamps, and sales outcomes consistent in one source of truth so your reports support sound decisions.
- Prioritize one bottleneck at a time, then test a targeted change to messaging, qualification, or follow-up.
Sales Funnel Analytics and KPIs: What They Measure and Why They Matter
Sales funnel analytics show how prospects move from their first interaction with a business through inquiry, sale, and retention. They help you see where interest turns into action, where potential customers stall, and whether marketing activity contributes to meaningful sales outcomes. The journey isn’t always a straight line: a prospect might return to your website or respond to a later campaign before deciding to buy. The Purchase Funnel offers foundational context for thinking about this path from awareness to action.
For a service business, funnel analytics can connect activity from Facebook Ads, pay-per-click campaigns, or search optimization with what happens after someone gets in touch. The goal isn’t to collect every available number. It’s to use a small, relevant set of measures to make the next business decision clearer.
How funnel metrics differ from KPIs
A metric describes an activity or outcome. A KPI is a metric selected to measure progress toward a stated business goal. Inquiry count, for example, tells you how many people reached out. Qualified-lead rate shows what share met your criteria for a potential customer. Both can be useful, but they answer different questions.
Choose a KPI because it helps someone act. If the goal is to book more suitable appointments, qualified-lead rate may matter more than total inquiries. Assign an owner who can investigate the result and influence it, such as the person responsible for campaign quality or lead follow-up. Tracking every click, call, and form interaction can bury the signal in noise. Start with measures tied to current goals, then add detail when it helps explain a change or choose an action.
What a service-business funnel can include
A practical funnel gives your team shared language for tracking prospects. One service-business version might include:
- Awareness and inquiry: Someone encounters the business and submits a form, calls, or otherwise makes contact.
- Lead qualification: The business checks whether the prospect’s needs fit the service and sales process.
- Appointment or estimate: A suitable lead schedules a conversation, visit, or estimate.
- Sale: The prospect accepts the offer and becomes a customer.
- Retention: The business tracks continued engagement, repeat work, or referrals where relevant.
Your process may combine, rename, or skip stages. A business that sells without appointments might move directly from qualification to sale. A company with a longer decision process may need additional steps. That’s where thoughtful sales funnel development supports measurement: stages should reflect how prospects actually become customers, not force the team into a generic template.
Before calculating rates, agree on each stage’s name and entry criteria. Decide, for example, what makes an inquiry a qualified lead and when an opportunity counts as a sale. Consistent definitions help everyone interpret the numbers the same way, giving sales funnel analytics and KPIs a reliable foundation for decisions.
Which Sales Funnel KPIs to Track at Each Stage
Start with a lean scorecard, not a wall of numbers. A useful KPI connects a clearly defined funnel stage to a business decision, so your team knows what to watch and what action the result might call for. The Sales Funnel Analytics discussion from IBM also emphasizes examining performance across the sales process rather than treating each interaction as an isolated result.
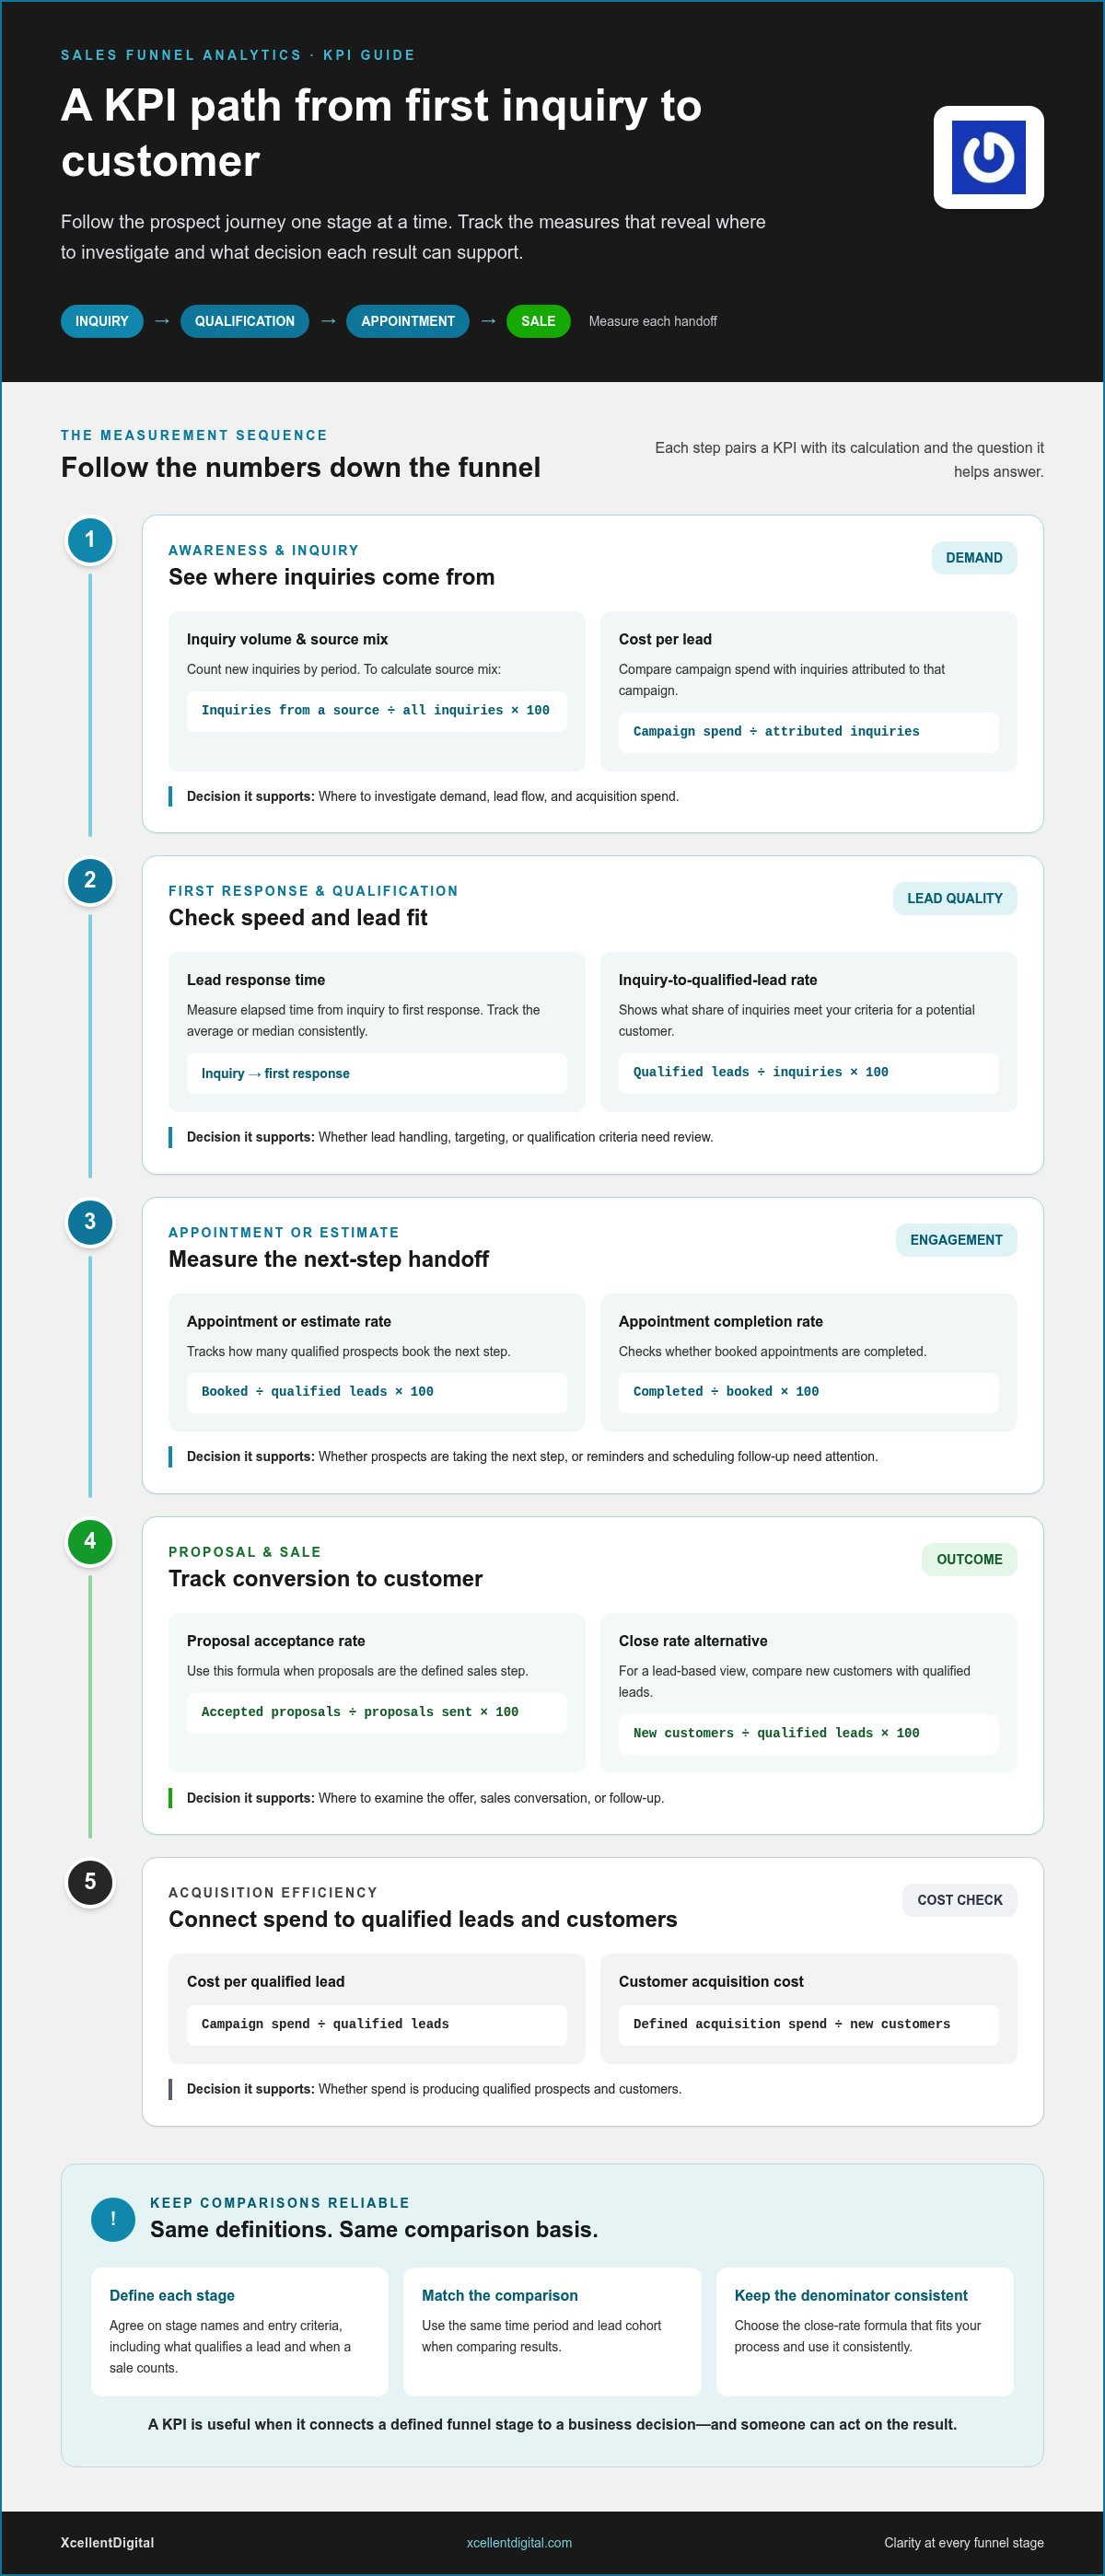
For sales funnel analytics and KPIs, choose measures that match your service process. Use the same time period and lead cohort when comparing results. These core calculations can give a small team a practical starting point:
| Stage and KPI | What it measures and formula | Decision it supports |
|---|---|---|
| Inquiry volume and source mix | New inquiries by period; source mix = inquiries from a source ÷ all inquiries × 100. | Where to investigate demand and lead flow. |
| Cost per lead | Campaign spend ÷ inquiries attributed to that campaign. | Whether acquisition spend merits a closer look. |
| Inquiry-to-qualified-lead rate | Qualified leads ÷ inquiries × 100. | Whether targeting or qualification criteria need review. |
| Appointment or estimate rate | Appointments or estimates booked ÷ qualified leads × 100. | Whether qualified prospects are taking the next step. |
| Appointment completion rate | Completed appointments ÷ appointments booked × 100. | Whether reminders or scheduling follow-up need attention. |
| Proposal acceptance or close rate | Accepted proposals ÷ proposals sent × 100; or new customers ÷ qualified leads × 100. Keep the chosen denominator consistent. | Where to examine the offer, sales conversation, or follow-up. |
| Lead response time | Elapsed time from inquiry to first response. Track the average or median consistently. | Whether lead handling needs more consistent processes. |
| Cost per qualified lead and customer acquisition cost | Campaign spend ÷ qualified leads; total defined acquisition spend ÷ new customers. | Whether spend is producing qualified prospects and customers. |
Prioritize lead quality before volume
More inquiries don’t automatically mean more opportunity. A campaign can generate activity while attracting people who aren’t a fit, so pair inquiry volume with source mix and qualified-lead rate. Use matching date ranges and consistent definitions. Dividing this month’s spend by leads from a different period, for example, can distort cost per lead or cost per qualified lead.
Track later stages when they fit your process
For a longer sales process, sales-cycle length is the time from a defined starting stage to a sale. Pipeline velocity estimates how quickly qualified opportunities may generate value, often using opportunity count, average deal value, win rate, and sales-cycle length. Treat these as internal comparison tools, not universal benchmarks. After the sale, track retention, repeat purchases, or referrals only if they reflect how your business grows.
Use the smallest scorecard that reveals a next step. If your stages or handoffs need structure, sales funnel development can help connect lead generation, follow-up, and sales outcomes into a process you can measure.
How to Interpret Funnel Analytics Without Misreading the Numbers
A conversion rate is a clue, not a verdict. Before changing a campaign or sales process, check that the records, definitions, and time periods behind the number are sound. Strong sales funnel analytics and KPIs help you locate a possible bottleneck, but they don’t explain its cause on their own.
Find the stage where prospects drop away
Compare the number of prospects entering each stage with the number moving to the next. A sudden drop points to a place worth investigating, but first check for missing records, duplicate inquiries, or leads assigned to the wrong stage. Then break down the figures by source and response time. Weak qualification from one campaign suggests a different issue than suitable leads waiting too long for a reply.
| Symptom | Plausible causes | Next data check |
|---|---|---|
| Inquiry volume is steady, but few leads qualify. | Audience or message may be attracting poor-fit inquiries; qualification rules may also be applied inconsistently. | Compare qualification rates by source and review a sample of lead records against the agreed criteria. |
| Qualified leads rarely book. | The next step may be unclear, scheduling may be difficult, or follow-up may be delayed. | Check response times, contact attempts, and booking rates by source. |
| Appointments are booked but often don’t happen. | Scheduling, reminders, or expectations set during booking may need attention. | Compare booked and completed appointments, then review cancellation and no-show records. |
| Sales fall despite stable appointment numbers. | Lead fit, offer clarity, proposal follow-up, or sales handling could be affecting close rates. | Review outcomes by lead source and compare accepted proposals with proposals sent. |
Read conversion rates and attribution in context
For every rate, state the numerator, denominator, cohort, and time period. Compare like with like: use the same stage definitions, lead sources, and measurement windows. A rate based on a handful of inquiries can swing sharply after one or two outcomes. Seasonality can shift demand and customer readiness, too, so avoid treating a brief change as a trend. Industry benchmarks are useful only as context. Check their source, publication date, and whether the population and conversion definition match your business.
Consider this illustrative example, not a benchmark: during one month, a service business records 40 inquiries, qualifies 20, books 12 estimates, completes 9, and wins 3 sales. Inquiry-to-qualified-lead rate is 20 ÷ 40, or 50%. The completed-estimate-to-sale rate is 3 ÷ 9, or about 33%. The second figure doesn’t prove the sales conversation is the problem. Inspect proposal follow-up and lead sources before deciding.
Attribution adds another layer. A prospect may first find a business through search, later see a Facebook ad, then submit an inquiry after returning directly. A single-source report may credit only the last interaction, while another model may share credit across touchpoints. Treat channel attribution as a useful view, not a complete account of why a sale happened, and use consistent reporting rules when comparing performance.
Build a Reliable Sales Funnel KPI Tracking and Review Process
A useful dashboard depends on dependable records. If one person marks a lead qualified at first contact while another waits until an appointment is booked, your conversion trends won’t mean much. Build the tracking routine around shared definitions, clear ownership, and checks that catch errors before they shape decisions.
Trend comparisons require consistent stage definitions and date ranges. Keep that rule visible in your reporting process, especially when comparing campaign performance or reviewing changes over time.
- Define each stage. Document the exact event that moves a lead into and out of every stage. For example, decide whether a lead becomes qualified after meeting set fit criteria or only after a sales conversation.
- Choose focused KPIs. Start with measures tied to a business outcome and add diagnostic KPIs only when they help explain performance. Record each formula, data source, and reporting period.
- Assign owners. Name who updates lead status, source, timestamps, and sales outcomes. Set responsibility for checking incomplete records and resolving duplicates, too.
- Validate the data flow. Map advertising, website, call, and CRM records where you use them. Test a few sample leads from first interaction through outcome to confirm that sources and stage changes appear as expected.
- Review and act. Set a regular review cadence. Record the finding, chosen action, owner, and follow-up result so each review leads to learning, not just another report.
Set definitions, data sources, and ownership
Use one source of truth for each lead’s status, source, key timestamps, and sales outcome. That might be your CRM or another system your team consistently maintains. Campaign platforms can show ad activity, while website analytics can show on-site behavior, but neither should silently replace the agreed record of lead progress and sale outcomes.
Make the workflow easy to follow. If the team relies on automated lead response, keep the response event and its timestamp visible alongside the lead’s later status. Automation can support consistent handling, but it can’t correct unclear stage rules or missing sales updates.
Choose a useful dashboard and review cadence
Keep the dashboard practical: one primary outcome, such as qualified opportunities or completed sales, plus a few measures that help explain movement toward it. Break results down by channel, service, or cohort only when there are enough comparable records to make the view useful. A thin slice of data can create noise instead of insight.
At each review, ask what changed, where it changed, and what evidence supports a next step. If a channel brings inquiries but few qualified leads, check lead records and qualification patterns before changing spend. Log the decision, who owns it, and when you’ll assess the result. This creates a clear feedback loop between campaign activity, follow-up, and sales outcomes.
If you want a clearer process for turning funnel data into coordinated marketing and follow-up, explore sales funnel development with XcellentDigital.
Turn Sales Funnel KPI Insights Into Focused Growth Improvements
Analytics become valuable when they change what you do next. Resist the urge to fix every weak number at once. Prioritize one bottleneck by weighing its likely impact on a business goal, how confident you are about the cause, and whether you can test a practical change. A high-impact issue with clear evidence and a manageable test is usually a stronger starting point than a dramatic-looking metric without context.
Choose the next test from the evidence
Turn the finding into a short test plan: state the observed problem, the most plausible cause, the proposed change, and the KPI that will indicate whether the change helped. For example, if qualified leads from one campaign book fewer estimates than leads from other sources, check the campaign message and the lead’s expectations before changing the booking process. Test one major variable at a time when practical, so you can interpret the result.
Use a defined baseline, such as the same stage’s conversion rate over a comparable period before the change. Keep stage definitions and calculation methods consistent. Choose a review window that fits your sales cycle and the number of leads you typically receive. If volume is low or deals take time to close, allow enough time for outcomes to mature rather than judging the test on early activity alone. The result may support, reject, or leave the original explanation uncertain. Each outcome can guide the next move.
Connect measurement with campaign and follow-up execution
Review advertising source data alongside qualified leads, appointments, and closed sales. A channel producing plenty of inquiries may deserve a closer look if few become qualified opportunities; another source with fewer inquiries may contribute more completed sales. Use the same attribution approach across the comparison, and remember that prospects can interact with multiple channels before making contact.
For example, a review of Facebook Ads for local lead generation should go beyond clicks or form submissions. Follow the leads through qualification and sales outcomes, then investigate where the journey changes. If suitable leads aren’t moving forward, check message alignment, qualification steps, and follow-up consistency before assuming the campaign itself is the only issue.
Lead response automation can support consistent engagement by helping ensure inquiries enter a defined follow-up process. It doesn’t replace measurement: funnel KPIs still show whether leads qualify, book, and become customers. Together, campaign analytics, sales funnel development, and automation can help connect advertising activity with outcomes, without assuming any single change guarantees growth.
Build your next improvement around the evidence, set a baseline, and review what happens. If you’re ready to connect advertising, funnel development, and lead response automation in a more coordinated growth plan, explore XcellentDigital’s growth and automation support.
Make Your Next Funnel Decision Count
Your next step doesn’t need to be a complete overhaul. Choose one business outcome to improve, make sales funnel analytics and kpis part of your regular decision-making, and build from what the evidence shows. A steady cycle of measurement and focused testing can help replace guesswork with clearer direction.
XcellentDigital brings advertising and search optimization together with sales funnel development, while AI agents and lead response automation support prospect engagement and follow-up workflows. Connect those efforts to the outcomes you’re tracking so your marketing activity and sales process can work toward the same goals.
Explore how XcellentDigital connects marketing, funnels, and automation, and take the next step toward more informed growth. Start with one decision, then keep moving forward.
Frequently Asked Questions
What are sales funnel analytics and KPIs?
Sales funnel analytics measure how prospective customers progress through a business’s buying process, while KPIs highlight progress toward an important goal. For a plumbing company seeking suitable service requests, the total number of form submissions is useful context, but the share that meets its service criteria may better show whether lead generation is attracting the right prospects. Define what makes an inquiry qualified first, so the result reflects your actual process rather than a generic metric list.
Which KPIs should a small business track in its sales funnel?
Choose a small set based on the question you need to answer: qualified leads for lead quality, stage conversion for progress, response time for follow-up, close rate for sales outcomes, and acquisition cost when spend and customer records are dependable. A business booking consultations may care about booked appointments, while one selling directly may not need that measure. Add a diagnostic KPI only when it helps explain a real change, such as why qualified inquiries stopped advancing.
How do you calculate sales funnel conversion rate?
Divide the number of leads reaching a specified next stage by the number eligible to enter that stage, then multiply by 100. For example, if 8 of 20 inquiries book an appointment, the inquiry-to-appointment rate is 40%. Label the stages, cohort, and reporting period so the calculation can be repeated fairly. A lead-to-customer rate answers a different question, so don’t compare it directly with an inquiry-to-appointment rate.
What is the difference between a sales funnel metric and a KPI?
A metric is any measured activity or result; a KPI is a metric chosen to judge progress toward a business objective. If a campaign generates 50 inquiries, that count describes volume. If the goal is to attract suitable prospects, the qualified-lead rate may be more useful for assessing progress. The inquiry count still has value, but only alongside context, a person responsible for reviewing it, and a decision it can inform.
How often should you review sales funnel KPIs?
Set a review cadence that fits your lead volume, sales-cycle length, and ability to respond to a finding. A team might check whether new inquiries are being handled regularly, then review conversion trends over a longer interval so outcomes have time to develop. Checking rates too often with only a few records can make normal variation look like a major shift. Keep the schedule consistent and note what action each review prompted.
What happens if your funnel conversion rate drops?
First check whether the calculation, stage rules, or reporting dates changed; a tracking adjustment can create an apparent decline. Then locate the stage where fewer prospects advance and compare sources or customer groups if the records support it. For instance, a drop limited to one campaign may point to lead fit, while a broader decline could warrant checking follow-up or stage handling. Test one focused change against a comparable baseline before making larger adjustments.
Can sales funnel analytics show which marketing channel generates the best leads?
Yes, if source information is recorded consistently and connected to lead qualification and sales outcomes. Compare channels using qualified leads, cost per qualified lead, and closed business, not inquiry totals alone. A channel with fewer inquiries could still be more valuable if more of its prospects become customers. Attribution can be incomplete when buyers encounter several channels, so document how credit is assigned and treat channel comparisons as evidence, not definitive proof of what caused each sale.











Leave a Reply
Want to join the discussion?Feel free to contribute!