

Cost Per Lead Benchmarks by Industry: 2026 Guide
A low cost per lead can hide an expensive problem: inquiries that never become customers. Cost per lead benchmarks by industry are useful only when you compare like with like, including the channel, campaign spend, and what counts as a lead.
If you’ve seen very different averages for the same industry, the reason may be that the figures measure different things. Benchmarks vary by channel, time period, and lead definition, so a form fill isn’t always comparable to a qualified prospect. This guide explains how to assess a relevant 2026 benchmark, compare channel results, and calculate a break-even CPL that fits your sales economics.
You’ll find industry and channel figures, guidance on defining a lead, and a practical way to set a target using close rates and customer value. The goal is to evaluate qualified leads and customer conversions alongside CPL, so you can see more than the price of a form fill.
Key Takeaways
- Use cost per lead benchmarks by industry as context, not a universal target. Channel, time period, and lead definition all affect the comparison.
- Compare Google, Meta, and LinkedIn figures using consistent campaign objectives and lead criteria.
- Calculate a break-even CPL from your allowable customer acquisition cost and lead-to-customer close rate.
- Track lead quality and customer conversions alongside CPL to identify campaigns that produce fewer, more valuable prospects.
- Use funnel tracking and timely follow-up to understand what happens after an inquiry and make better-informed campaign decisions.
What Does Cost Per Lead Mean, and What Can an Industry Benchmark Tell You?
Cost per lead is meaningful only when you know which marketing costs you’re counting and what qualifies as a lead. Without those rules, an industry average may look precise but tell you little about whether your campaign is working.
Cost per lead (CPL) is the attributable marketing spend required to generate one defined lead during a set period. It measures the cost of an inquiry or prospect, not the cost of winning a customer. Customer acquisition cost (CAC) measures the cost of gaining a paying customer, so it also reflects what happens after a lead comes in.
A raw inquiry might be a form submission or phone call. A qualified lead meets your criteria for a potential customer, such as having a relevant need or being in your service area. A closed customer has purchased. Keep these stages separate: counting every inquiry as a qualified prospect can make CPL look better than the campaign’s actual sales performance.
How do you calculate cost per lead?
CPL = attributable marketing spend ÷ leads generated during the same period
The numerator is the marketing spend assigned to the campaign and period you’re measuring. The denominator is the number of leads that meet your stated definition during that same period. For a foundational overview, see What is Cost Per Lead (CPL)?
Hypothetical example: If a campaign spends $1,200 in one month and generates 30 valid inquiries in that month, its CPL is $40. This assumes all 30 inquiries meet the campaign’s lead rule and that $1,200 is the full attributable spend being counted. The calculation doesn’t show how many inquiries qualify or become customers.
Set your counting rules before comparing results. Decide whether a call counts when it connects, when a caller leaves a message, or only after the conversation meets your criteria. Apply a consistent rule to forms, too. Deduplicate repeat submissions from the same prospect according to a set policy, and decide whether unqualified inquiries belong in raw CPL or should be counted separately from qualified leads. Don’t change the rules between campaigns.
Why does a low CPL not always mean better performance?
Two campaigns can report the same CPL and deliver very different prospects. One may attract people ready to buy; another may generate casual inquiries, poor-fit requests, or duplicates. The headline cost doesn’t reveal that difference.
Connect lead volume to sales outcomes. If leads rarely close, the campaign may have a low CPL but a high CAC. If a smaller share of leads closes but each customer is valuable, a higher CPL may still fit your economics. The useful question isn’t simply whether leads are cheap. It’s whether the customers they produce justify the acquisition cost.
For a fair comparison, use the same lead definition, spend scope, and attribution window. An attribution window is the period in which you credit a marketing interaction with generating a lead. Compare form submissions with form submissions, or consistently counted calls with calls, rather than blending unlike actions. That discipline makes cost per lead benchmarks by industry useful reference points, not automatic targets.
2026 Cost Per Lead Benchmarks by Industry: Read the Source Before the Number
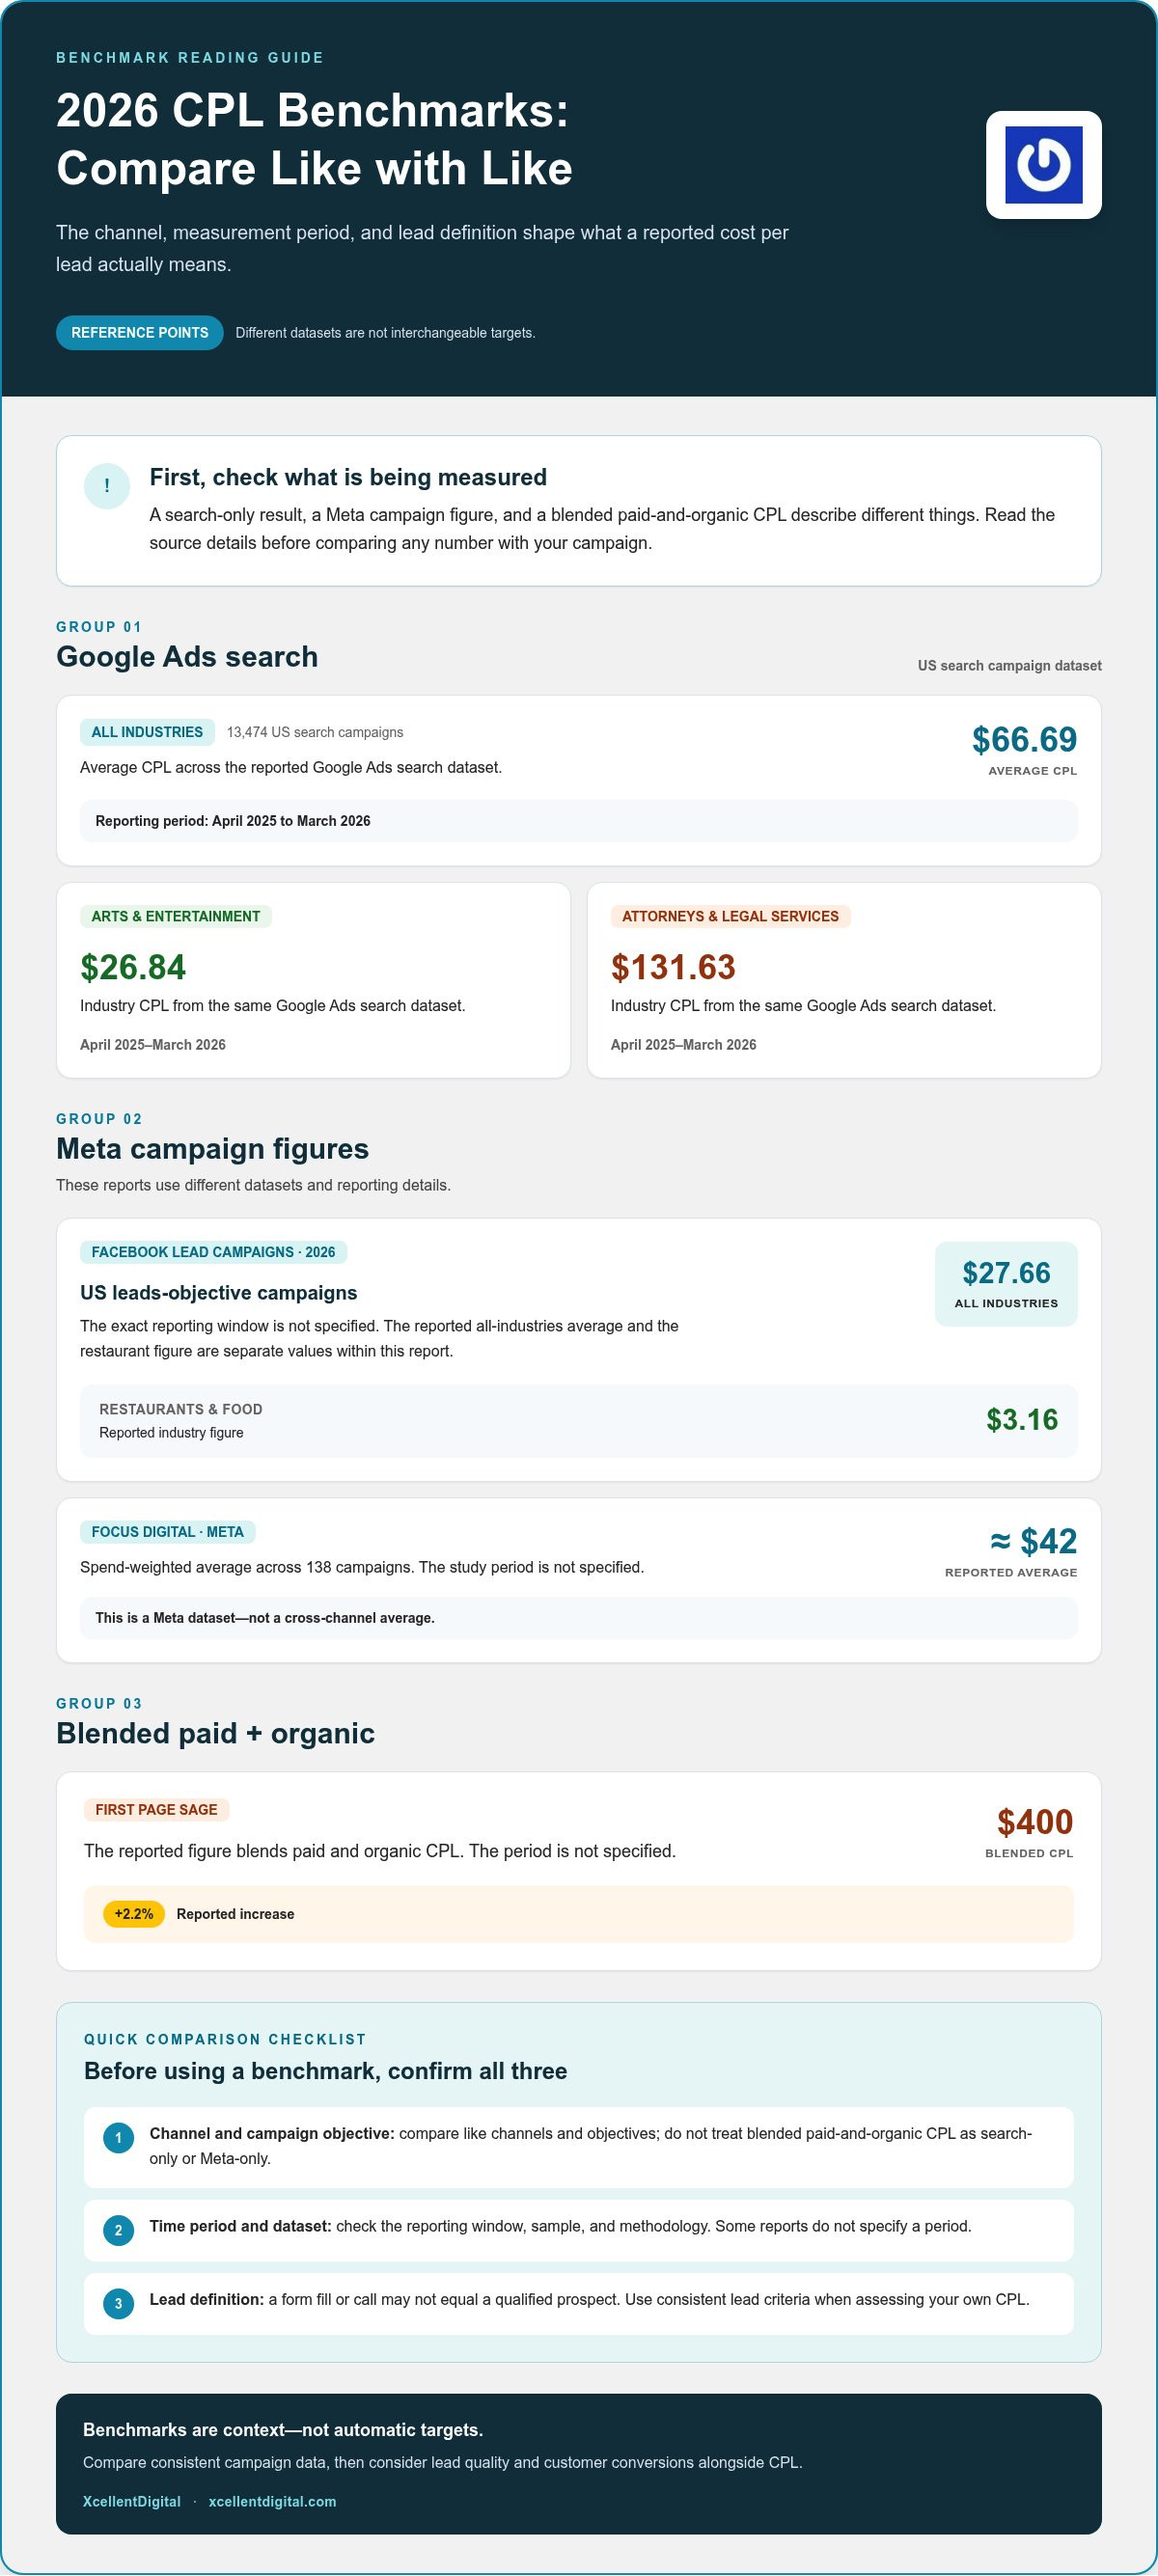
A benchmark without context can send you in the wrong direction. Before treating a reported CPL as a useful reference, compare its channel, sample, period, and lead definition with your own campaign. The figures below separate search, Meta, and blended results. They are not interchangeable targets.
| Industry or dataset | Channel | Period | Methodology and reported CPL |
|---|---|---|---|
| All industries, US | Google Ads search | April 2025 to March 2026 | 13,474 US search campaigns; average CPL: $66.69. |
| Arts and entertainment | Google Ads search | April 2025 to March 2026 | Industry figure from the same search-campaign dataset: $26.84. |
| Attorneys and legal services | Google Ads search | April 2025 to March 2026 | Industry figure from the same search-campaign dataset: $131.63. |
| Restaurants and food | Facebook lead campaigns | 2026; exact window not specified | US leads-objective campaign average: $27.66 across all industries. The reported industry figure is $3.16. |
| All industries | Paid and organic, blended | Period not specified | First Page Sage reports a $400 blended CPL, up 2.2%. This is not a search-only or Meta-only result. |
| Meta campaigns | Meta | Study period not specified | Focus Digital reports an approximately $42 spend-weighted average across 138 campaigns. It is a Meta dataset, not a cross-channel average. |
What do the available 2026 benchmark reports measure?
Search-ad figures describe a different dataset from Meta campaign results, while the blended figure combines paid and organic CPL. Don’t treat the $400 blended result as a channel benchmark or compare it directly with a platform-specific average. Reporting periods and methods differ across these figures, so check the details provided with each benchmark before using it to assess your campaign.
Other reported search-ad figures, such as the Clique Studios industry range, should also be treated as search benchmarks, not universal industry CPLs. Compare the full figures and definitions with your campaign’s channel, lead criteria, and measurement period.
Why can two cost per lead benchmarks disagree?
Different channels reach people with different intent, and campaign objectives can count different actions as conversions. A form submission, phone inquiry, and sales-qualified prospect aren’t automatically equivalent. Sample size, date range, and weighting matter as well: a spend-weighted average gives more influence to campaigns that spend more, while other methods may treat campaign results differently.
Before comparing, check geography and currency, then confirm the attribution window and lead criteria. The figures above are US-dollar benchmarks where the table specifies US data. Don’t assume a figure with missing geography or currency matches your market. Benchmarks describe a dataset, not a guaranteed target for your business.
Use cost per lead benchmarks by industry to frame questions, then measure your own campaigns using consistent tracking. XcellentDigital’s digital advertising, search optimization, and sales funnel development can help connect campaign activity with lead quality and follow-up. Explore campaign support.
Google, Meta, and LinkedIn CPL: Compare Channels Without Mixing the Data
A platform’s CPL reflects how it reaches people and what action it counts, not just the price of an ad. Google search can capture people actively looking for a solution. Meta can put an offer in front of selected audiences, including people who haven’t started searching. LinkedIn adds a professional audience context that may suit some B2B goals. Compare results against the same business goal and qualification rules before choosing a channel based on cost per lead benchmarks by industry.
| Platform and campaign type | Reported CPL | What the figure measures | Limitation to keep in mind |
|---|---|---|---|
| Google Ads search | See the search benchmarks in the preceding table | Search campaigns capture expressed demand. The reported figures are tied to a specific search-campaign dataset and period. | Search intent and lead actions may differ from social campaign audiences and conversion actions. |
| Meta, B2B prospecting | $200-$400 | Prospecting campaigns seek new audiences, according to the 2026 benchmark data. | This is a B2B Meta range, not a universal Meta or all-industry average. |
| Meta, B2B retargeting | $50-$150 | Retargeting reaches people who have already interacted with a business or its content, according to the 2026 benchmark data. | Audience familiarity differs from prospecting, so the two campaign types aren’t like-for-like. |
| LinkedIn Lead Gen Forms | $45-$95 | Leads submit a form within the platform, according to the 2026 benchmark data. | Form completion doesn’t establish lead quality or customer potential. |
| LinkedIn external landing pages | $65-$140 | People click through to a separate landing page to convert, according to the 2026 benchmark data. | The extra step changes the conversion action, making direct comparisons with in-platform forms difficult. |
When should businesses compare search, Meta, and LinkedIn leads?
Compare channels when they’re working toward the same business outcome, such as qualified sales conversations, and when qualification criteria match. Search often responds to an expressed need; paid social can introduce an offer to people based on audience selection or prior interaction. LinkedIn’s professional context may be relevant for reaching business audiences, but its fit depends on the audience and offer. A raw inquiry from one platform shouldn’t automatically count as equivalent to a qualified prospect from another.
For contractor campaigns aimed at high-intent searches, the PPC for Contractors: 2026 High-Intent Lead Gen Guide explores the search-channel context.
How do ad format and funnel stage change reported CPL?
Focus Digital’s Meta campaign findings report $34.10 for Lead Form Ads and $33.15 for bottom-of-funnel campaigns. The figures come from a Meta-specific study, and the reporting period isn’t specified. Treat them as study results, not universal rates. A lower-friction form may increase submissions, but more submissions don’t automatically mean more qualified prospects. Track qualification and sales outcomes alongside CPL, and compare formats within the same campaign objective and follow-up process.
How to Set Your Own Target CPL and Diagnose a High Cost
An industry average can help you identify questions, but your sales data sets the limit. Build a target from actual campaign spend, a consistent lead count, and the economics of the customers you win. Then look beyond raw CPL to see how prospects move through your funnel.
How do you calculate a business-specific break-even CPL?
Start by deciding the maximum customer acquisition cost (CAC) your business can support after accounting for delivery costs and the profit you need to retain. Multiply that allowable CAC by the share of leads that become customers. The result is a planning threshold, not a promised campaign result or a guarantee that every lead will perform alike.
Break-even CPL = allowable CAC × lead-to-customer close rate
Hypothetical example: If your allowable CAC is $600 and 20% of leads become customers, your planning threshold is $120 per lead. Use your own close rate over a consistent period. This example illustrates the calculation only.
Follow this process to set and monitor a target:
- Choose a period and scope. Set the dates and decide which campaign costs you’ll include.
- Record actual spend. Use attributable marketing spend for that same period, rather than a budget or estimate.
- Apply one lead rule. Count leads consistently, accounting for duplicate inquiries and the actions you treat as valid leads.
- Calculate actual CPL. Divide the period’s spend by the leads counted under that rule.
- Compare the result with your threshold. Review qualified leads, booked appointments, customers, and revenue alongside raw CPL.
That last step matters. If raw CPL is below target but few leads qualify or close, the campaign may not be meeting your sales goal. If CPL exceeds target but leads turn into valuable customers, assess CAC and customer value before deciding the campaign is underperforming.
What should you investigate when CPL rises?
First, check whether the change reflects performance or measurement. Look for tracking gaps, attribution changes, duplicate inquiries, and edits to the conversion action. Then review whether audience intent, offer fit, or landing-page friction has shifted. A form change, for example, can affect both submission volume and the meaning of a counted lead.
Next, compare cost per qualified lead and CAC with the previous period using the same definitions. A higher CPL paired with a stronger qualification rate may tell a different story from a rise accompanied by fewer qualified prospects. A sustainable target depends on your margin and close rate. Keep cost per lead benchmarks by industry in perspective and let your funnel data guide adjustments.
Consistent campaign management and sales funnel development can help you connect ad spend with lead quality and sales outcomes. Use those measures to decide what to adjust rather than reacting to one CPL figure.
Turn CPL Benchmarks into Better Campaign Decisions with XcellentDigital
A benchmark is a starting point, not a campaign plan. To make it useful, connect ad spend to the steps that follow an inquiry: qualification, appointment booking, and customer conversion. XcellentDigital provides digital advertising, sales funnel development, and lead response automation to help businesses assess lead quality alongside CPL. The aim is clearer measurement and a more consistent process, not a guaranteed reduction in lead costs.
What should a useful lead-generation report show?
Build reports that trace performance from source to outcome. Organize results by channel and campaign, then use consistent definitions for spend and lead counts. A practical report can include:
- Marketing spend and raw leads, grouped by channel and campaign.
- Qualified leads, using the same qualification criteria across reporting periods.
- Appointments and customers, when those outcomes are tracked and connected to the original inquiry.
- Revenue, when attribution supports a reliable connection to the campaign.
Keep the attribution window and lead rules consistent. Otherwise, a reporting change may look like a performance change. For example, if one campaign counts every form submission and another counts only qualified inquiries, their CPLs don’t describe the same result. A clear view of each funnel stage helps you spot where leads are dropping off, rather than reacting to the top-line number alone.
How can faster follow-up support lead conversion?
An inquiry is only the beginning of the sales process. Lead response automation can streamline engagement after a prospect reaches out, while funnel development makes the next step visible, such as a response sent, a conversation started, or an appointment booked. XcellentDigital implements AI agents and automated workflows for prospect engagement. These tools support a defined follow-up process; they don’t guarantee a particular conversion or revenue outcome.
For more on structured follow-up, see Lead Response Automation and Instant Engagement. If Facebook is part of your mix, Facebook Ads: 2026 Local Lead Gen Guide for Services offers additional channel context. Together, campaign reporting and follow-up data can show whether a lower CPL is producing useful prospects or simply more inquiries.
Use cost per lead benchmarks by industry to frame your questions, then bring your campaign and sales data into the decision. XcellentDigital can connect ad management, funnel development, and lead response workflows to help you evaluate performance and identify where the process needs attention. Ready to make your lead data more actionable? Talk with XcellentDigital about your campaign goals and lead-generation process.
Make Your Next Campaign Decision with Confidence
Let a benchmark prompt a better question: what do you want your next campaign to teach you about the path from inquiry to customer? Set a clear goal, decide how you’ll judge lead quality, and structure the campaign so you can see where prospects move forward or stall. That turns cost per lead benchmarks by industry into context for decisions grounded in your own business.
For your next campaign review, compare CPL with qualification rates, customer conversions, and the follow-up process. This gives you a clearer basis for deciding what to keep, adjust, or test next.
Frequently Asked Questions
What is a good cost per lead by industry?
There isn’t one good CPL for every business in an industry. Use cost per lead benchmarks by industry as a comparison point, then check whether the benchmark matches your channel, offer, and lead criteria. For example, a campaign aimed at people ready to book may need a different target from one collecting early-stage interest. Review qualified-lead and customer outcomes, too. A low number isn’t useful if the inquiries don’t fit your business.
Why is my cost per lead higher than the industry benchmark?
A higher CPL may reflect a different channel, audience, offer, or conversion action from the one used for the benchmark. First, check for tracking changes or duplicate counts. Then compare the share of leads that qualify, complete a landing-page action, and become customers. For example, a campaign attracting fewer but better-fit prospects may cost more per inquiry yet support stronger sales outcomes. Diagnose the funnel before treating the industry average as a required ceiling.
Is a lower cost per lead always better?
No. A cheaper form submission can come from a broader audience or an easier form that attracts people with limited buying intent. Compare how many inquiries qualify, book appointments, and become customers. If a higher-cost campaign produces stronger-fit prospects who close more often, it may be more useful than a large volume of weak inquiries. Review outcomes over comparable periods so one unusual week doesn’t drive a lasting campaign change.
Which advertising platform has the lowest cost per lead?
No platform is always the least expensive choice. Search, Meta, and LinkedIn reach people in different contexts, and each report may count a different action as a lead. Match the campaign objective to your sales goal: a search inquiry, a social form submission, and a professional-network lead may not represent the same level of intent. Compare qualified leads and customer outcomes in your own reporting before shifting budget based on a platform average.
How much should a business spend to generate leads?
Set a test budget based on the qualified opportunities your team can handle and the acquisition cost your customer economics can support. Define the channel, time period, and conversion action before launching, then review what happened beyond the initial inquiry. If the campaign generates more leads than your team can follow up with, additional spend may not help. Scale only after you understand lead quality and downstream sales results.
What is the difference between CPL and customer acquisition cost?
CPL measures the marketing cost of generating a lead; customer acquisition cost (CAC) measures the cost of gaining a paying customer. CAC reflects that some prospects don’t buy and may include sales expenses as well as marketing. For a practical comparison, track campaign leads alongside customers won during the same attribution period, and account for sales costs in your CAC calculation. CPL helps assess lead generation; CAC helps evaluate the broader path to a sale.













Leave a Reply
Want to join the discussion?Feel free to contribute!