

How to Estimate Lead Generation ROI From Sales Projections
Positive revenue doesn’t always mean a profitable campaign. To understand how to calculate lead generation ROI, subtract the campaign cost from the profit generated by its leads, divide the result by the campaign cost, then multiply by 100. For example, $40,000 in gross profit from a $10,000 investment equals 300% ROI.
A lead generation ROI calculation is useful only when its inputs reflect how your business actually sells. Include the full cost of generating and following up with leads, then account for how many qualified prospects become customers and how long sales take to close. This guide explains what lead generation ROI measures, walks through a worked example, and shows how close rates and sales cycles shape revenue projections. You’ll have a clearer way to compare campaign results with their actual costs and decide what to improve next.
Key Takeaways
- Project customer wins from qualified opportunities and your actual close rate, then estimate revenue using the value of each closed deal.
- Match your ROI measurement window to the sales cycle; a 30-day revenue snapshot can miss results when deals take longer to close.
- Count the full cost of lead generation, including follow-up labor, tools, and management overhead, for a more realistic return.
- Track lead-to-opportunity conversion and cost per opportunity to see where your funnel is losing momentum and what to improve.
Revenue projections based on sales cycle and close rate
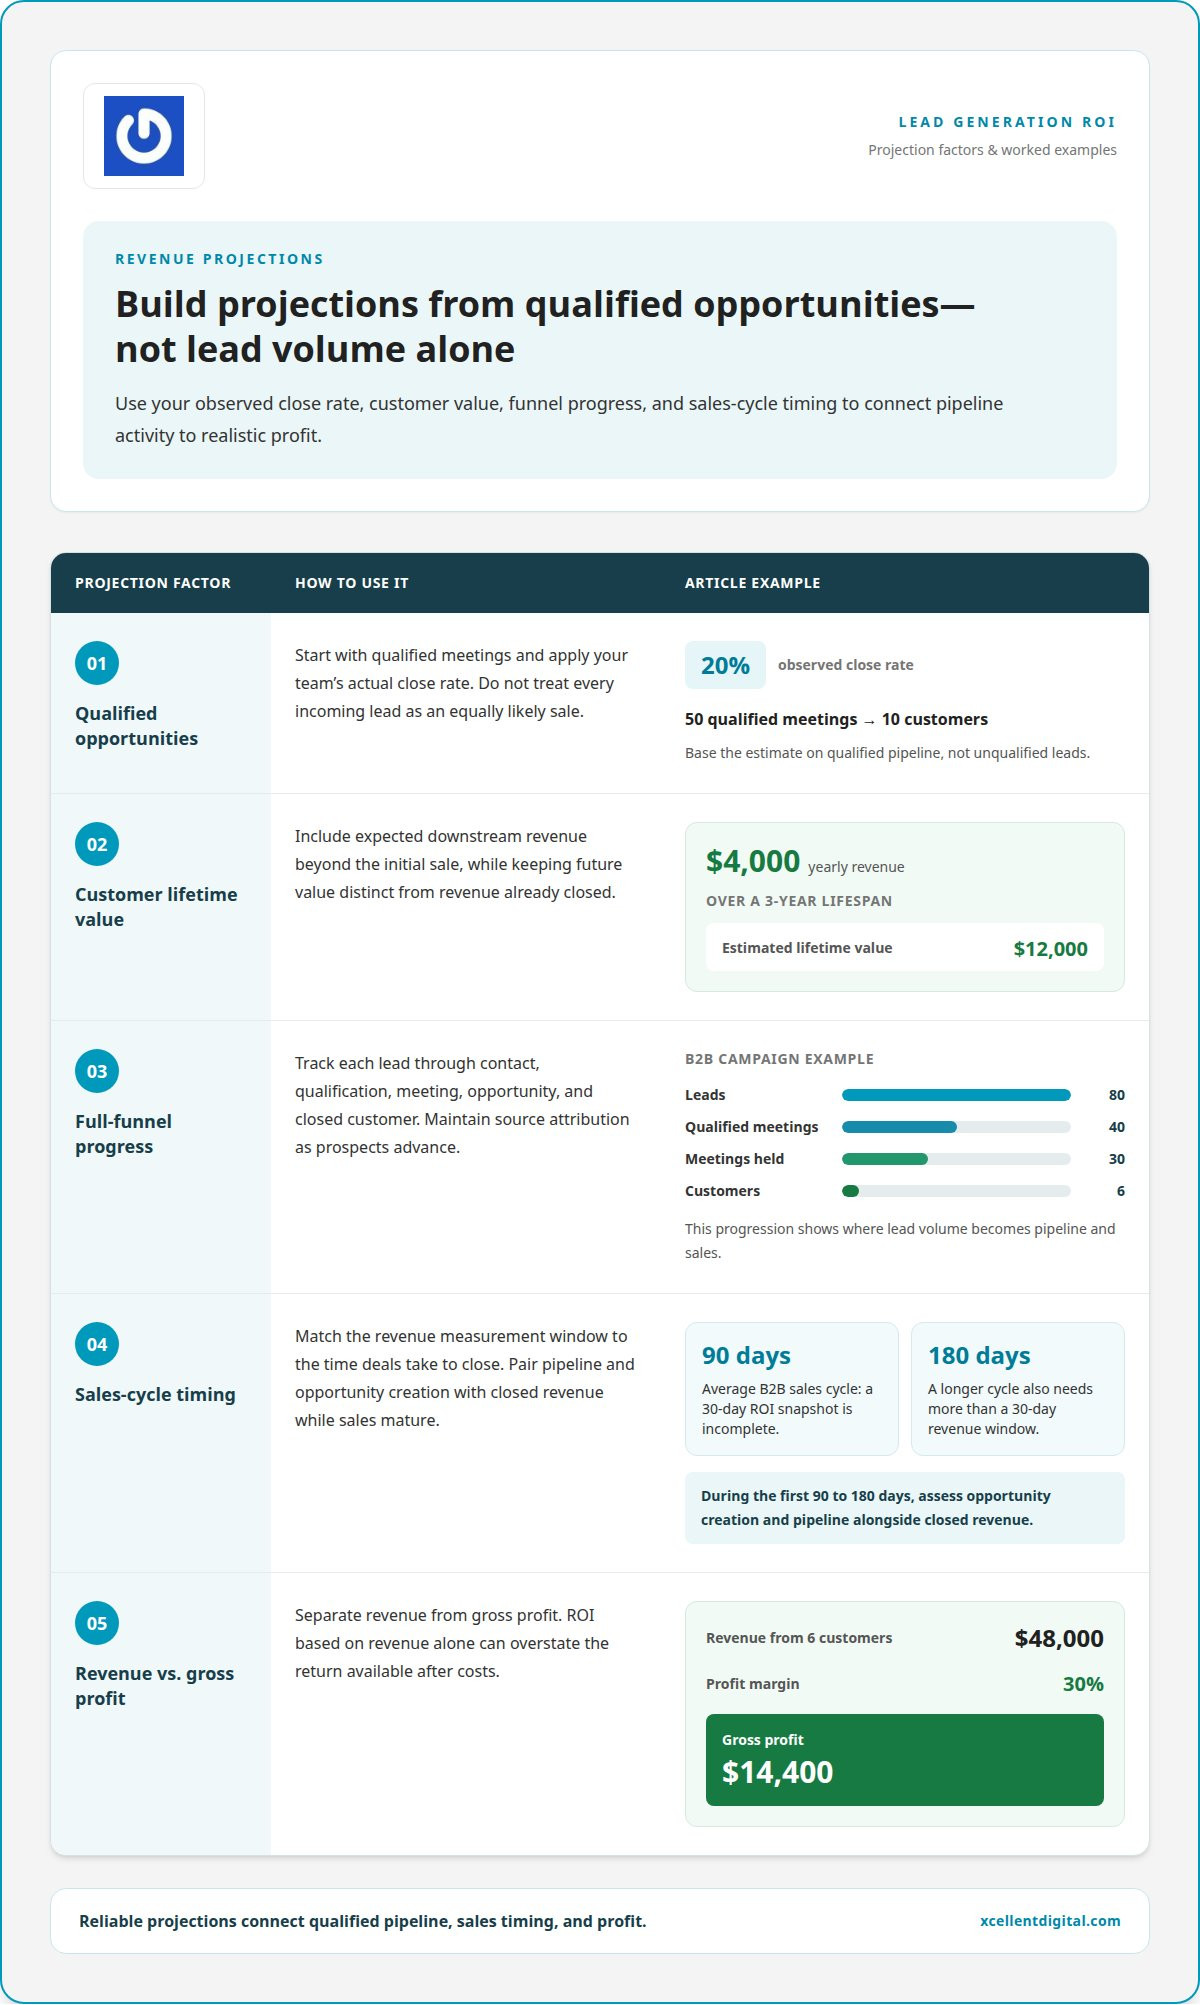
Build projections from qualified opportunities, close rate, customer value, and the time deals take to close. Track each funnel stage so projected revenue reflects sales progress, not just lead volume.
- Start with qualified meetings and your observed close rate. At a 20% close rate, 50 qualified meetings can produce 10 customers. Apply your team’s actual rate to the opportunities in your pipeline; don’t treat every incoming lead as a likely sale. For example, an opportunity that hasn’t been qualified shouldn’t carry the same revenue projection as one actively moving toward a decision.
-
Include Lifetime Value and Downstream Revenue
Estimate customer lifetime value by adding the revenue a customer is expected to generate over the relationship. For example, $4,000 in yearly revenue over a three-year lifespan gives an estimated lifetime value of $12,000. Use that figure to capture downstream revenue beyond the initial sale, but distinguish expected future value from revenue already closed. Otherwise, a projection can make a campaign look more profitable than its current sales results show.
-
Connect Leads to Pipeline and Revenue
Track each lead through contact, qualification, meeting, opportunity, and closed customer. In a B2B campaign example, 80 leads produced 40 qualified meetings, 30 meetings held, and six customers. That full-funnel progression shows where volume turns into pipeline and sales. Record the source channel and maintain attribution as prospects advance, so revenue receives appropriate credit rather than being counted against several channels.
- Match the revenue window to the sales cycle. A B2B sales cycle averaging 90 days makes a 30-day ROI measurement incomplete; a 180-day cycle also needs more than a 30-day revenue window. During the first 90 to 180 days, assess opportunity creation and pipeline alongside closed revenue. Then separate revenue from gross profit: the example campaign’s six customers generated $48,000 in revenue, while a 30% profit margin produced $14,400 in gross profit. ROI based on revenue alone can overstate the return available after costs.
What is lead generation ROI?
Lead generation ROI measures the return from lead-generation spending, while cost per lead tracks only acquisition volume. Compare channels using the same period, full costs, and closed-customer results; there’s no universal B2B benchmark, though 3:1 to 5:1 is commonly cited as a healthy return.
-
Measure Opportunity Costs and Conversion
Track leads through qualification, then divide qualified opportunities by total leads to find lead-to-opportunity conversion. For example, 12 leads producing three qualified opportunities yield a 25% conversion rate. Calculate cost per opportunity by dividing campaign spend by qualified opportunities; appointment-setting costs of $3,000 for 30 qualified meetings equal $100 per meeting. Compare this metric across channels, not lead volume alone.
-
Account for Customer Acquisition Costs
Calculate customer acquisition cost by dividing sales and marketing spend by new customers gained. For a fully loaded figure, include follow-up labor, tools, and management overhead alongside campaign spend. Apply the same cost categories to each channel, then track CAC monthly with conversion and closed-sale data for an accurate comparison.
-
Compare ROI with Cost per Lead
Use cost per lead to see what each lead costs, then use ROI to assess the return after conversion and sales. Compare channels using qualified leads, closed customers, and the same measurement window. Don’t credit a low lead cost with revenue it didn’t produce.
-
Set an Allowable Acquisition Cost
Set an allowable Cost of Customer Acquisition against customer lifetime value (LTV). Using 10% of LTV as a starting point, a cable company with $4,800 LTV can allocate $480 to acquire a customer. Some companies set the allowance at 15% to 20% or more. No single ROI benchmark fits every industry, so weigh margin, customer value, and sales data rather than treating one ratio as a universal target.
Lead generation ROI formula and worked example
The practical question is how to calculate lead generation ROI consistently across business models. Use attributable profit for both B2B and B2C, but choose inputs that reflect how each business earns: contract profit and a longer sales process may suit B2B, while transaction profit and repeat purchases may fit B2C.
-
Apply the Lead Generation ROI Formula
Start by defining the return as profit attributable to the campaign, not unadjusted revenue. Use this formula: (profit from leads − lead generation cost) ÷ lead generation cost × 100. Include closed sales tied to the campaign’s source, and match the measurement period for profit and spending. This separates pipeline forecasts from realized results and makes comparisons more consistent.
To see how to calculate lead generation ROI for a campaign, use $3,000 in attributable returns and a $1,000 investment. Subtract the investment, divide the remaining $2,000 by $1,000, then multiply by 100. The result is 200% ROI, or a 3:1 return including the investment in the ratio.
-
Work Through ROI Examples
Apply the same calculation to each source. A campaign costing $5,000 and generating $20,000 in returns has 300% ROI: ($20,000 − $5,000) ÷ $5,000 × 100. Record the source, closed deals, and spending together so another channel’s sales don’t receive credit by mistake.
For a forecast, estimate how many leads will qualify, apply the close rate, and use expected profit per customer. Mark the result as projected until the deals close. Don’t compare projected pipeline from one campaign with realized profit from another. Keep attribution rules and inputs consistent, then review the figures as sales mature. This gives you a fairer basis for deciding which campaigns to test, adjust, or continue investing in.
Calculating lead generation ROI
Make ROI useful for decisions by standardizing costs, qualified outcomes, attribution, and measurement periods. Then compare each lead source using the same method.
- Set one measurement period and define which leads count as qualified. Review accepted leads, rejection reasons, and speed-to-lead during the first 7 to 14 days. Track lead source through opportunity and sale, so each campaign receives appropriate credit. Separate projected pipeline from closed revenue; mixing them makes the resulting percentage difficult to interpret.
- Calculate the full investment before comparing channels. Add internal time and management overhead when they apply. Use the same cost categories across campaigns, or cost per lead and ROI won’t provide an accurate comparison.
- Follow conversion from lead to qualified opportunity and customer. For example, a campaign generating 500 leads, 10 qualified leads, and two customers has a clear funnel to assess. Calculate each stage’s conversion using its previous stage as the denominator. This reveals whether volume is failing at qualification or later in sales, helping focus strategy on the actual drop-off.
- Apply the ROI formula to profit attributed to the lead source, not revenue alone. For example, $50,000 in revenue minus $45,000 in total costs leaves $5,000 in profit. Divide that profit by the $45,000 investment and multiply by 100 for the ROI percentage. Keep campaign spending and attributed profit aligned to the same period.
- Choose a review cadence that respects channel timing. Review paid advertising monthly, while evaluating SEO and sponsorships quarterly. For a B2B sales cycle averaging 90 days, a 30-day revenue window is incomplete. Track qualified opportunities and pipeline while sales progress, then update ROI as deals close. Refine your lead-source tracking to connect marketing activity with outcomes.
XcellentDigital: Facebook Ads
XcellentDigital offers Facebook Ads for businesses building a lead-generation channel they can evaluate against sales outcomes. Consider this approach when you need to connect campaign activity with qualified inquiries, pipeline progress, and closed revenue, rather than judging performance by lead volume alone.
Set clear qualification criteria, record each lead’s source, and track what happens after an inquiry arrives. This helps reveal whether leads advance to opportunities or stall during follow-up. Use those findings to make better-informed decisions about campaign strategy and measurement.
To discuss how Facebook Ads could fit your lead-generation goals, visit xcellentdigital.com.
Turn your next campaign into a clearer decision
Knowing how to calculate lead generation ROI gives you more than a campaign score. It helps you decide what to test, where to focus, and which results merit further investment. Take a practical next step: use consistent tracking, review lead quality alongside sales outcomes, and let those findings shape your marketing strategy.
If your data leaves gaps between marketing activity and closed business, XcellentDigital can help connect the pieces. Its services include Facebook Ads, Google Business Profile Optimization, and AI Agents, supporting different parts of lead generation and follow-up. Choose the area that best matches the challenge you’re working to solve, then build from there.
Talk with XcellentDigital about your lead-generation goals and the next step for your business. Clearer measurement starts with a focused plan, and you can put that plan into motion with confidence.
Frequently Asked Questions
How Do I Use My ROI Number To Make Better Decisions?
Use ROI to choose what to improve, continue, or pause, not as a verdict on its own. If a channel brings valuable customers but struggles to convert inquiries, focus on lead handling before increasing spending. Compare results with your business goals and operational capacity, too. A campaign that generates more demand than your team can serve may need a different plan, even if its return looks strong.
How does better ROI measurement change decisions?
Better measurement helps identify which part of a campaign needs attention. Separate performance by audience, offer, and landing page, then compare each segment using consistent definitions. For example, if one offer attracts inquiries but few qualified prospects, refine the message or qualification process before changing the entire campaign. This makes your next decision more specific than simply increasing or cutting the total budget.
How does closed-loop visibility improve ROI measurement?
Closed-loop visibility connects a marketing interaction to what happens after the inquiry, including sales outcomes recorded by your team. Keep campaign identifiers attached as prospects move through your CRM, and regularly reconcile records with sales data. This can expose duplicate conversions, missing sources, or deals credited to the wrong activity, giving you a clearer record of which marketing touchpoints contribute to business outcomes.
What Are Some Common ROI Mistakes?
Common mistakes include counting duplicate inquiries as separate leads, ignoring refunds or canceled deals, and changing qualification rules between campaigns. Comparing channels with different attribution windows can also shift credit unfairly. Audit a sample of records against CRM and billing data before drawing conclusions. If records don’t match the stated measurement rules, reported ROI can mislead decisions.
What Is ROI, And Why Should You Track It?
ROI helps judge whether an investment produced enough value to justify its resources. Tracking it connects marketing choices to business outcomes, rather than relying only on activity such as clicks or form submissions. Use it alongside customer quality and operational fit: a channel may look attractive on paper but bring customers whose needs don’t align with your capacity or business priorities.
What Should You Ask Before Trusting Your ROI Numbers?
Ask whether the calculation uses consistent campaign dates, complete expense records, and sales linked to the activity being measured. Check whether repeat customers, cancellations, and refunds are handled consistently, and whether the report distinguishes actual results from forecasts. These checks help you spot gaps in the underlying records before making a budget or strategy decision.













Leave a Reply
Want to join the discussion?Feel free to contribute!